 |
 |
 |
 |
 |
|
| ||
|
May 30, 2006
You are on the invidual archive page of The great Chinese money vacuum. Click Simon World weblog for the main page.
|
|
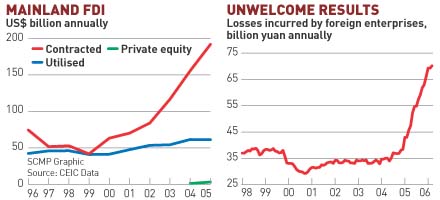
The great Chinese money vacuum
Jake van der Kamp observes in today's SCMP that what foreigners promise to invest in China isn't necessarily what they actually put in...and what they do put in loses money hand over fist. Chart below the jump.
Trackbacks:
TrackBack URL for this entry: http://blog.mu.nu/cgi/trackback.cgi/170161 Send a manual trackback ping to this post. hawaiian poker shirt Excerpt: hawaiian poker shirt You will be awarded some great honor. Weblog: hawaiian poker shirt Tracked: June 13, 2006 09:22 PM diet and weight loss Excerpt: diet and weight loss Weblog: diet and weight loss Tracked: June 26, 2006 11:02 AM cheapest cialis Excerpt: cheapest cialis Weblog: cheapest cialis Tracked: June 26, 2006 11:04 AM
Comments:
there are also some (partial) expalanations to these charts -- the artificialness of these numbers The charts don't seem to discuss the ratio of profit-making foreign investment to losing. That would seem to be the key stat, no? Naturally if more companies invest, there will be more losses, especially in the initial phases of the investment, when investors are sinking cash into long-term projects. Michael posted by: Michael Turton on 06.05.06 at 08:50 AM [permalink] |
|