 |
 |
 |
 |
 |
|
| ||
|
April 08, 2006
You are on the invidual archive page of Chart of the week. Click Simon World weblog for the main page.
|
|
Chart of the week
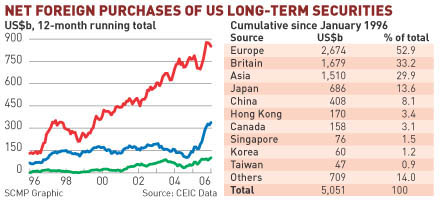
Courtesy of Jake van der Kamp at the SCMP, a chart of which overseas countries have been buying US Treasuries (below the jump) which should turn conventional wisdom on who's buying these securities on its head. As he concludes: And China? Well, over the last 10 years China accounted for only 8.1 per cent of total net inflows to the US by way of long-term securities purchases. Even this figure is likely to decline soon as China's overall trade surplus is now narrowing rapidly and it will not have as much money for the game as it previously did.You don't hear much about the rising Saudi menace, do you?
Trackbacks:
TrackBack URL for this entry: http://blog.mu.nu/cgi/trackback.cgi/160811 Send a manual trackback ping to this post.
Comments:
but is it true??? Check the date on the fax, Jake! I'd be highly suspicious of the chart. The figures for purchases a) only reflect the residence of who's buying (and a British bank can buy for the Chinese government as easily as a Chinese one) and b) don't reflect the secondary market, which is the most important part of the treasuries trading market. The annual figures for holdings of treasuries are more accurate, but even those only reflect the custodian institution, which may be holding for someone else. Doesn't negate the point that demonising China on this is yet another reflection of the US obsession with blaming anyone but themselves for the imbalances in their economy. posted by: Duncan on 04.10.06 at 01:20 PM [permalink] |
|